Weather conditions last updated on June 16, 2026, 6:32 am CDT
| Description | Currently | Today’s High | Today’s Low |
|---|---|---|---|
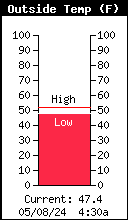
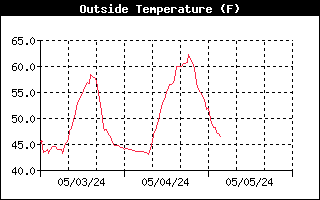
| Temperature | 49.8°F | 55.6°F at 12:00 am | 49.4°F at 4:51 am |
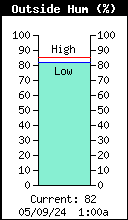
| Humidity | 87% | 89% at 12:00 am | 83% at 1:36 am |
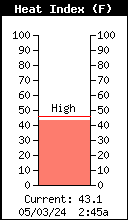
| Heat Index | 50.0°F | 56.0°F at 12:00 am | |
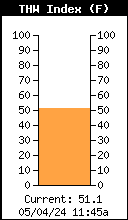
| THSW Index | 47.7°F | ||
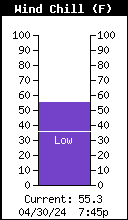
| Wind Chill | 47.5°F | 45.0°F at 5:04 am | |
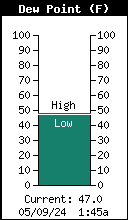
| Dew Point | 46.1°F | 53.0°F at 12:00 am | 46.0°F at 3:42 am |
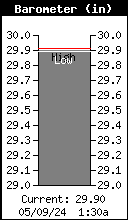
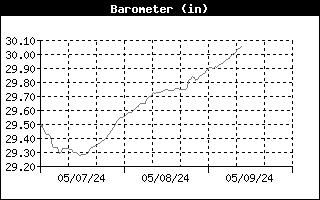
| Barometer | 29.805" and Steady | 29.805" at 6:32 am | 29.762" at 12:00 am |
| Wind Speed (10-min avg) | 6.0 m.p.h. | 29.0 m.p.h. at 12:31 am | |
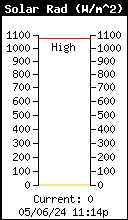
| Solar Radiation | 58 W/m2 | 58 W/m2 at 6:32 am | |
| Sunrise | 5:34 am CDT | ||
| Sunset | 9:15 pm CDT |
Short-Term Forecast
Today
Increasing clouds. Highs in the lower 70s. Northwest winds 5 to 15 mph.
Tonight
Mostly cloudy. Chance of rain showers in the evening, then chance of rain showers and slight chance of thunderstorms after midnight. Lows in the mid 50s. South winds 5 to 15 mph. Chance of precipitation 50 percent.
Wednesday
Breezy. Rain showers likely in the morning, then rain showers and chance of thunderstorms in the afternoon. Highs in the upper 60s. Southeast winds 10 to 15 mph shifting to the northwest 15 to 25 mph in the afternoon. Chance of precipitation 90 percent.
Forecast data effective June 16, 2026, 5:32 am
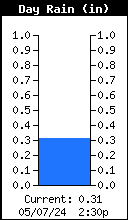
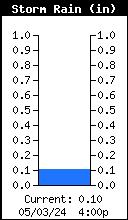
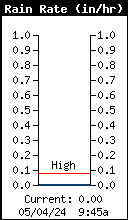
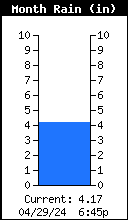
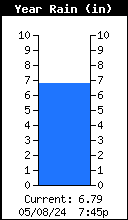
| Description | Rate | Day | Storm | Month | Year |
|---|---|---|---|---|---|
| Rain | 0.00"/hour | 0.00" | 0.22" | 2.60" | 5.42" |
Today’s Graphs
Today’s graphs are automatically generated every fifteen minutes and display today’s data or the three-day trend.