Station and data updates
The campus weather page receives data updates every three to five minutes, 24 hours per day. The page is automatically refreshed every five minutes. The campus camera image is automatically refreshed every 30 seconds. Today's summary and weather history pages are updated every 15 and 30 minutes, respectively.
Data collected by the station is shared every 15 minutes. Data are being used by over 400 institutions worldwide for various purposes such as weather and climate modeling and forecasting. Those include the National Weather Service, NOAA, NASA, and a large number of universities.
Weather alert data is updated directly from the National Weather Service public alert feed system every 3 minutes. Data is only obtained for NWS Zone MNZ047 and/or NWS County MNC149 (Stevens county, Minnesota). While this system provides real-time alert updates, it is important to note that the campus weather station data is provided as a courtesy service with no guarantee (explicit or implied) of 100% accuracy or uptime. As such, please do not solely rely on information provided on this website for emergency alerts.
Station hardware
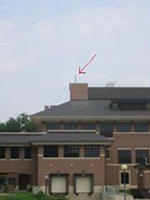
The campus weather station is located on top of the science building and has been in operation since June 7, 2007. It is registered at 45° 35’ 20” N, 95° 54’' 7” W, at an altitude of 1175 ft (measurement includes building height).
The Vantage Pro weather station includes sensors for temperature, pressure, humidity, wind speed and direction, and rainfall. Weather information is updated approximately every 5 minutes.
The weather station was installed and is maintained by the physics discipline. Primary motivation is use of the data for instructional purposes, in courses such as Phys1063 Physics of Weather. Information Technology maintains the data connection and dissemination via this informational page.
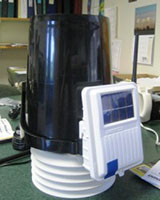
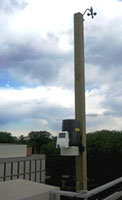
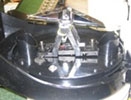
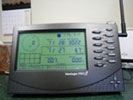
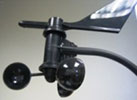
Shown (clockwise):
- Physical location on the science building;
- Integrated Sensor Suite (ISS) including rain gauge, radiation shield with temperature, pressure and humidity sensors;
- station as it is installed on the roof;
- wind vane;
- console;
- tipping buckets for the rain gauge.
Measurement definitions
- Wind Chill
- The Wind Chill uses air temperature and wind speed in order to define an apparent temperature felt on exposed skin. The heat flow rate away from the skin is higher if wind is present. The Wind Chill temperature corresponds to the temperature of resting air with an equivalent heat flow rate from exposed skin. It will always be lower than the air temperature.
- Heat Index
- The Heat Index uses the temperature and the relative humidity to determine how hot the air actually “feels.” When humidity is low, the apparent temperature will be lower than the air temperature, since perspiration evaporates rapidly to cool the body. However, when humidity is high (i.e., the air is saturated with water vapor) the apparent temperature “feels” higher than the actual air temperature, because perspiration evaporates more slowly.
- THW Index
- The THW Index uses humidity, temperature and wind to calculate an apparent temperature that incorporates the cooling effects of wind on our perception of temperature. The THW index combines apsects of wind chill and heat index.
- Dew Point
- Dew point is the temperature to which air must be cooled for saturation (100% relative humidity) to occur, providing there is no change in water content. The dew point is an important measurement used to predict the formation of dew, frost, and fog. If dew point and temperature are close together in the late afternoon when the air begins to turn colder, fog is likely during the night. Dew point is also a good indicator of the air’s actual water vapor content, unlike relative humidity, which takes the air’s temperature into account. High dew point indicates high vapor content; low dew point indicates low vapor content. In addition a high dew point indicates a better chance of rain and severe thunder storms. You can even use dew point to predict the minimum overnight temperature. Provided no new fronts are expected overnight and the afternoon relative humidity 50%, the afternoon’s dew point gives you an idea of what minimum temperature to expect overnight, since the air is not likely to get colder than the dew point any time during the night.
- Relative Humidity
- Relative humidity is defined as the percentage of the partial pressure of water vapor compared to the saturation pressure of water vapor at the current temperature. Since the saturation pressure (onset of condensation) is strongly temperature-dependent, a change in relative humidity occurs due to temperature changes as well as actual changes in water vapor content. The dew point is giving a better measure of the absolute moisture in the air. Relative humidity, however, corresponds better to our perception of humidity.
- Barometric Pressure
- The weight of the air that makes up our atmosphere exerts a pressure on the surface of the earth. This pressure is known as atmospheric pressure. Generally, the more air above an area, the higher the atmospheric pressure. This, in turn, means that atmospheric pressure changes with altitude. For example, atmospheric pressure is greater at sea level than on a mountaintop. To compensate for this difference in pressure at different elevations, and to facilitate comparison between locations with different altitudes, meteorologists adjust atmospheric pressure so that it reflects what the pressure would be if measured at sea level. This adjusted pressure is known as barometric pressure. Barometric pressure changes with local weather conditions, making barometric pressure an important and useful weather forecasting tool. High pressure zones are generally associated with fair weather, while low pressure zones are generally associated with poor weather. For forecasting purposes, the absolute barometric pressure value is generally less important than the change in barometric pressure. In general, rising pressure indicates improving weather conditions, while falling pressure indicates deteriorating weather conditions.
- Wind Speed
- Current wind speed is updated by the sensor every eight seconds. The average wind speed is calculated as the average of the past 15 minutes. The high wind speed is the highest value of the past 15 minutes.
- Wind Direction
- The wind direction reading is sampled every eight seconds. If wind speed is greater than 0 when the WeatherLink software samples wind direction, it places a “marker” into one of sixteen “bins” that correspond to the sixteen compass points. At the time of the 15 minute archive, the WeatherLink determines which bin contains the most markers and writes the corresponding wind direction to the archive memory as the dominant wind direction.
- Wind Run
- Wind run is measurement of the “amount” of wind passing the station during a given period of time, expressed in “miles of wind.” The wind run is calculated by multiplying the average wind speed for each 15 minute archive record. For example, average wind speed = 5 mph; archive interval = 15 minutes (0.25 hours); wind run = 5 mph x 0.25 hours = 1.25 miles of wind.
- Rain Statistics
- The resolution of the tipping buckets is 0.01 inch of rain. The buckets will tip over if this amount of water has accumulated in one of the buckets, and register as a click. The rain rate is calculated by measuring the time interval between each rainfall increment. When there is rainfall within the 15 minute archive period, the highest measured value is reported. When no rainfall occurs, the rain rate will slowly decay based on the elapse time since the last measured rainfall.